All Plugins
QuickChart
Data VisualizationGenerate beautiful charts and graphs using Chart.js. Create bar charts, line graphs, pie charts, and more with a simple API.
The popular open-source charting library. This plugin passes your configuration directly—no abstraction layer.
Installation
npm install @teamflojo/floimg-quickchart Quick Start
import createClient from "@teamflojo/floimg";
import quickchart from "@teamflojo/floimg-quickchart";

const floimg = createClient();
floimg.registerGenerator(quickchart());

const chart = await floimg.generate({
  generator: "quickchart",
  params: {
    type: "bar",
    data: {
      labels: ["Q1", "Q2", "Q3", "Q4"],
      datasets: [{
        label: "Revenue",
        data: [120, 190, 80, 150],
        backgroundColor: ["#4CAF50", "#2196F3", "#FF9800", "#9C27B0"]
      }]
    }
  }
});

await floimg.save(chart, "./quarterly-chart.png");
API Reference
| Parameter | Type | Required | Description |
|---|---|---|---|
type | "bar" | "line" | "pie" | "doughnut" | "radar" | "polarArea" | Yes | The type of chart to generate |
data | ChartData | Yes | Chart.js data object with labels and datasets |
options | ChartOptions | No | Chart.js options for customization |
width | number | No | Image width in pixels (default: 800) |
height | number | No | Image height in pixels (default: 400) |
Examples
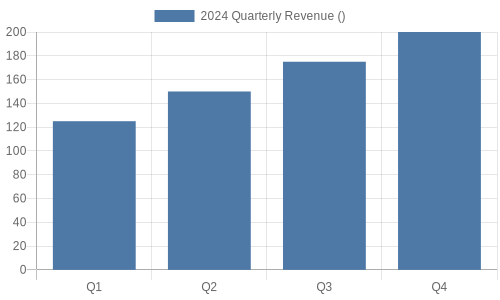
Quarterly Revenue
Bar chart showing quarterly revenue data
                      await floimg.generate({
  generator: "quickchart",
  params: {
    type: "bar",
    data: {
      labels: ["Q1", "Q2", "Q3", "Q4"],
      datasets: [{
        label: "Revenue ($K)",
        data: [120, 190, 80, 150]
      }]
    }
  }
});
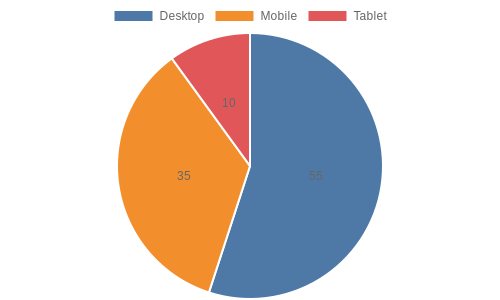
Traffic by Device
Pie chart showing device distribution
                      await floimg.generate({
  generator: "quickchart",
  params: {
    type: "pie",
    data: {
      labels: ["Desktop", "Mobile", "Tablet"],
      datasets: [{
        data: [55, 35, 10]
      }]
    }
  }
});
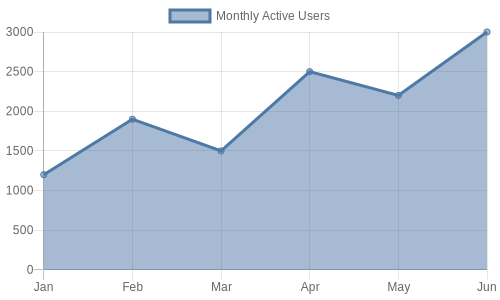
Monthly Users
Line chart showing user growth
                      await floimg.generate({
  generator: "quickchart",
  params: {
    type: "line",
    data: {
      labels: ["Jan", "Feb", "Mar", "Apr", "May"],
      datasets: [{
        label: "Users",
        data: [1200, 1900, 3000, 5000, 8000],
        fill: true
      }]
    }
  }
});