QuickChart
The QuickChart plugin generates charts and graphs using the Chart.js library.
Powered by Chart.js via QuickChart
This plugin passes your configuration directly to Chart.js—no FloImg abstraction layer. See the Chart.js docs for all available options.
Installation
Section titled “Installation”pnpm add @teamflojo/floimg-quickchartRegistration
Section titled “Registration”import createClient from '@teamflojo/floimg';import quickchart from '@teamflojo/floimg-quickchart';
const floimg = createClient();floimg.registerGenerator(quickchart());const chart = await floimg.generate({ generator: 'quickchart', params: { type: 'bar', data: { labels: ['Jan', 'Feb', 'Mar', 'Apr'], datasets: [{ label: 'Sales', data: [10, 20, 30, 40], backgroundColor: '#7c3aed' }] }, options: { plugins: { title: { display: true, text: 'Monthly Sales' } } } }});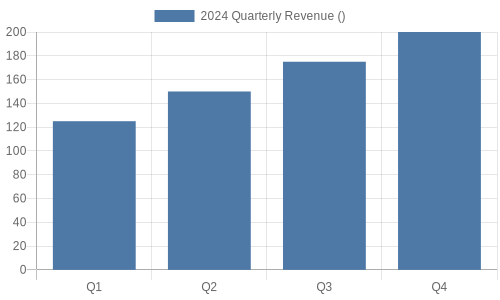
Parameters
Section titled “Parameters”| Parameter | Type | Required | Description |
|---|---|---|---|
type | string | Yes | Chart type (see below) |
data | object | Yes | Chart.js data configuration |
options | object | No | Chart.js options configuration |
width | number | No | Image width in pixels (default: 500) |
height | number | No | Image height in pixels (default: 300) |
backgroundColor | string | No | Background color (default: white) |
Chart Types
Section titled “Chart Types”Bar Chart
Section titled “Bar Chart”await floimg.generate({ generator: 'quickchart', params: { type: 'bar', data: { labels: ['A', 'B', 'C'], datasets: [{ label: 'Values', data: [10, 20, 30] }] } }});Line Chart
Section titled “Line Chart”await floimg.generate({ generator: 'quickchart', params: { type: 'line', data: { labels: ['Jan', 'Feb', 'Mar', 'Apr', 'May'], datasets: [{ label: 'Trend', data: [10, 15, 12, 18, 22], borderColor: '#7c3aed', fill: false }] } }});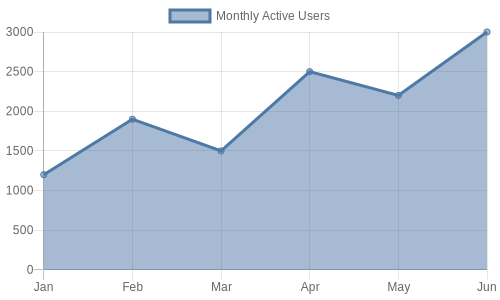
Pie Chart
Section titled “Pie Chart”await floimg.generate({ generator: 'quickchart', params: { type: 'pie', data: { labels: ['Red', 'Blue', 'Yellow'], datasets: [{ data: [300, 50, 100], backgroundColor: ['#ef4444', '#3b82f6', '#eab308'] }] } }});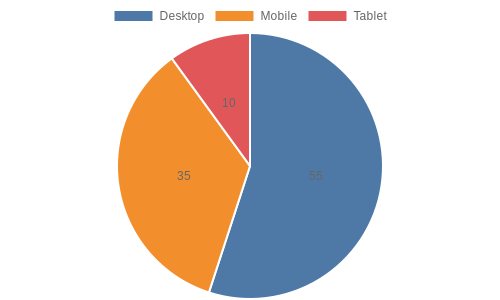
Doughnut Chart
Section titled “Doughnut Chart”await floimg.generate({ generator: 'quickchart', params: { type: 'doughnut', data: { labels: ['Desktop', 'Mobile', 'Tablet'], datasets: [{ data: [55, 35, 10] }] } }});Radar Chart
Section titled “Radar Chart”await floimg.generate({ generator: 'quickchart', params: { type: 'radar', data: { labels: ['Speed', 'Power', 'Accuracy', 'Range', 'Defense'], datasets: [{ label: 'Player 1', data: [80, 90, 70, 60, 85] }] } }});Advanced Options
Section titled “Advanced Options”Multiple Datasets
Section titled “Multiple Datasets”await floimg.generate({ generator: 'quickchart', params: { type: 'bar', data: { labels: ['Q1', 'Q2', 'Q3', 'Q4'], datasets: [ { label: '2023', data: [10, 20, 15, 25], backgroundColor: '#94a3b8' }, { label: '2024', data: [15, 25, 20, 30], backgroundColor: '#7c3aed' } ] } }});Custom Styling
Section titled “Custom Styling”await floimg.generate({ generator: 'quickchart', params: { type: 'line', width: 800, height: 400, backgroundColor: '#1e1e1e', data: { labels: ['Mon', 'Tue', 'Wed', 'Thu', 'Fri'], datasets: [{ label: 'Users', data: [120, 190, 150, 200, 180], borderColor: '#22c55e', backgroundColor: 'rgba(34, 197, 94, 0.1)', fill: true }] }, options: { scales: { y: { ticks: { color: '#fff' } }, x: { ticks: { color: '#fff' } } }, plugins: { legend: { labels: { color: '#fff' } } } } }});See Also
Section titled “See Also”Want to experiment visually? Try QuickChart in floimg-studio →