Back to Templates

Data Viz
Revenue Dashboard
Quarterly revenue chart with caption and web-optimized export
Claude Code Ready
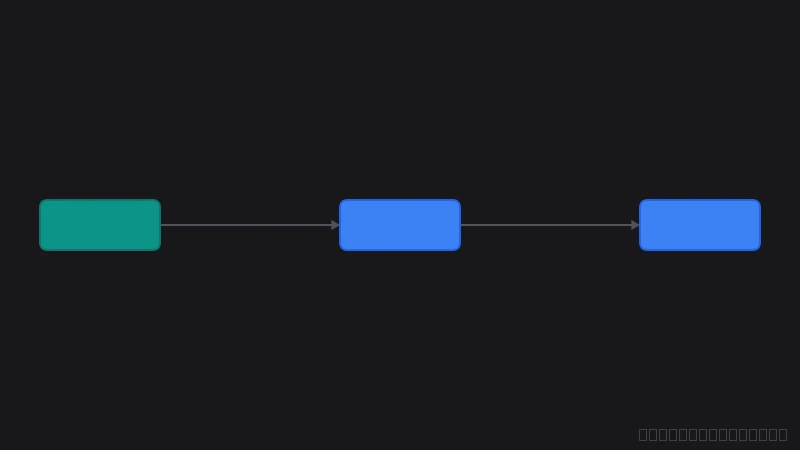
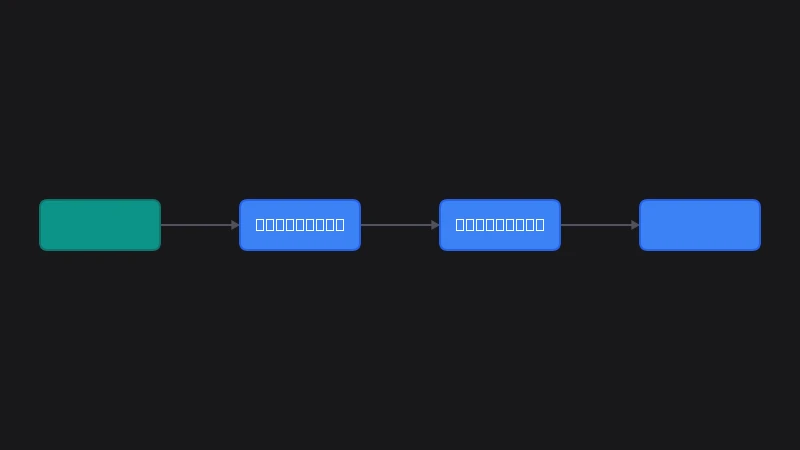
Multi-step Pipeline
How It Works
4 steps in this workflow
- 1 Generate chart (QuickChart)
- 2 Resize to 800×500
- 3 Add caption "Source: Finance Dash..."
- 4 Convert to WEBP