All Plugins
D3
Data VisualizationCreate advanced data visualizations using D3.js. Build custom charts, maps, and interactive visualizations.
Powered by D3.js
The JavaScript library for data-driven documents. This plugin passes your configuration directly—no abstraction layer.
Installation
npm install @teamflojo/floimg-d3 Quick Start
import createClient from "@teamflojo/floimg";
import d3 from "@teamflojo/floimg-d3";

const floimg = createClient();
floimg.registerGenerator(d3());

const viz = await floimg.generate({
  generator: "d3",
  params: {
    type: "treemap",
    data: {
      name: "root",
      children: [
        { name: "React", value: 45 },
        { name: "Vue", value: 30 },
        { name: "Angular", value: 15 },
        { name: "Svelte", value: 10 }
      ]
    }
  }
});

await floimg.save(viz, "./framework-usage.png");
API Reference
| Parameter | Type | Required | Description |
|---|---|---|---|
type | "treemap" | "sunburst" | "force" | "custom" | Yes | Type of D3 visualization |
data | object | Yes | Data structure for the visualization |
width | number | No | Image width in pixels (default: 800) |
height | number | No | Image height in pixels (default: 600) |
render | function | No | Custom D3 render function for type: custom |
Examples
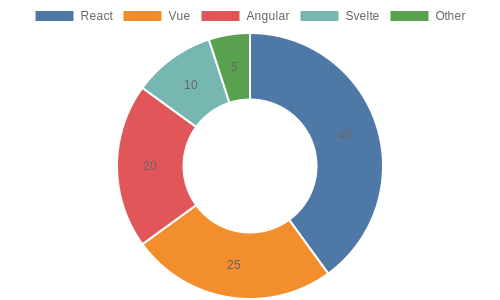
Framework Usage
Treemap showing framework popularity
                      await floimg.generate({
  generator: "d3",
  params: {
    type: "treemap",
    data: {
      name: "Frameworks",
      children: [
        { name: "React", value: 45 },
        { name: "Vue", value: 30 },
        { name: "Angular", value: 15 }
      ]
    }
  }
});